


Too many sales teams waste time chasing leads that will never convert. The problem usually is a poorly set-up lead scoring system that fails to capture the right signals from your prospects. Without the right system, you’re guessing which leads are worth your time.
In HubSpot, lead scoring is not just about assigning numbers; it’s about understanding who your most valuable prospects are and making sure your team focuses their efforts where they count.
Imagine spending hours nurturing leads that never had a chance of converting. That’s the reality of a generic scoring model. It can misclassify prospects and lead to missed opportunities, inefficient follow-ups, and wasted resources. But when your lead scoring system is aligned with your actual business needs, it helps your team prioritize, respond faster, and close deals more effectively.
In this guide, we’ll walk you through five essential lead scoring formulas that every HubSpot admin needs to set up. These strategies will ensure your sales team is always working with the highest-value leads.
What is Lead Scoring?
Not all leads are equal. Some are ready to buy, while others are just browsing. Lead scoring ranks prospects based on engagement and fit, assigning numerical values based on their behavior, demographics, and interest level. This helps sales teams focus on high-quality leads and avoid wasting time on unqualified ones.
Lead scoring in HubSpot aligns marketing and sales teams. It ensures both are on the same page when identifying a “sales-ready” lead, reducing wasted efforts and improving conversion rates. Without it, sales reps might pursue leads too early or miss out on high-potential prospects.
The 5 Important Lead Scoring Formulas
Lead scoring formulas assign numerical values to leads based on specific actions, characteristics, and behaviors. The goal is to quantify lead quality so your sales team knows who to prioritize. HubSpot allows you to create scoring models based on criteria like page visits, email engagement, form submissions, and more.
Engagement-Based Lead Scoring: This formula rewards leads based on their interactions with your brand, such as website visits, email engagement, and content downloads. Leads showing active interest are given higher scores.
Demographic & Firmographic Lead Scoring: This formula focuses on a lead’s fit with your business, considering factors like job title, company size, and industry. Decision-makers and leads from relevant industries are prioritized.
Behavioral Intent-Based Lead Scoring: This formula tracks behaviors that suggest a lead is closer to making a purchase, such as product page visits, free trial sign-ups, and webinar participation. High-intent actions get higher scores.
Lead Source & Channel-Based Lead Scoring: Leads from certain sources (e.g., organic search, referrals, paid ads) are given different scores based on their potential quality. Referral leads and organic search leads often have higher intent.
Sales Interaction & Lifecycle Lead Scoring: This formula looks at a lead’s engagement with sales, like demo requests or follow-up interactions. Leads showing a direct interest in sales activities are prioritized.
These formulas help filter out low-intent contacts and highlight those ready to move forward.
Below, you’ll find scoring breakdowns for each formula, including examples of both positive and negative activities to consider when setting up your system. These examples will guide you in refining your lead scoring approach and ensuring that you’re prioritizing the right leads.
1. Engagement-Based Lead Scoring
This model measures how leads interact with your content and marketing efforts. More engagement generally indicates stronger interest, but not all engagement is equal.
Formula: Assign points based on actions such as email opens, link clicks, website visits, and content downloads.
Scoring Breakdown Example:
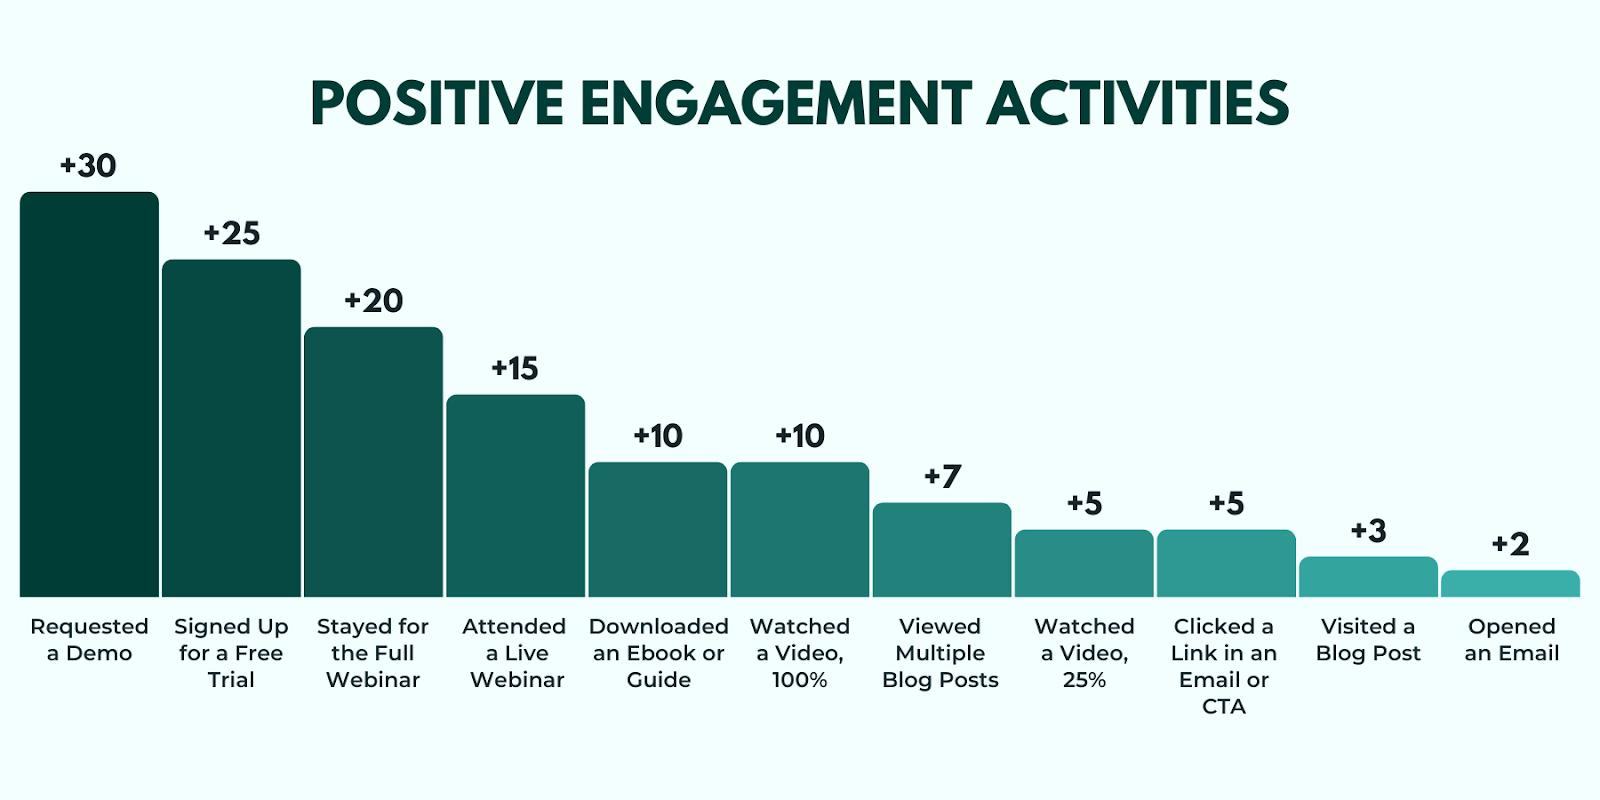
Positive Engagement Activities:
- Opened an Email (+2 points): Awareness-level interest but low intent.
- Clicked a Link in an Email or CTA (+5 points): Engaged enough to explore further.
- Visited a Blog Post (+3 points): Light engagement, but signals curiosity.
- Viewed Multiple Blog Posts in One Session (+7 points): Shows deeper research, possibly evaluating solutions.
- Watched a Video, 25% Completion (+5 points): Initial interest, but not fully engaged.
- Watched a Video, 100% Completion (+10 points): Strong engagement, especially if it’s product-related.
- Downloaded an Ebook or Guide (+10 points): Actively seeking information, may indicate early-stage interest.
- Attended a Live Webinar (+15 points): Willing to invest time, signals real interest.
- Stayed for the Full Webinar (+20 points): More committed, likely evaluating options.
- Signed Up for a Free Trial (+25 points): Clear buying intent, actively testing the product.
- Requested a Demo (+30 points): Sales-ready, highly engaged lead.
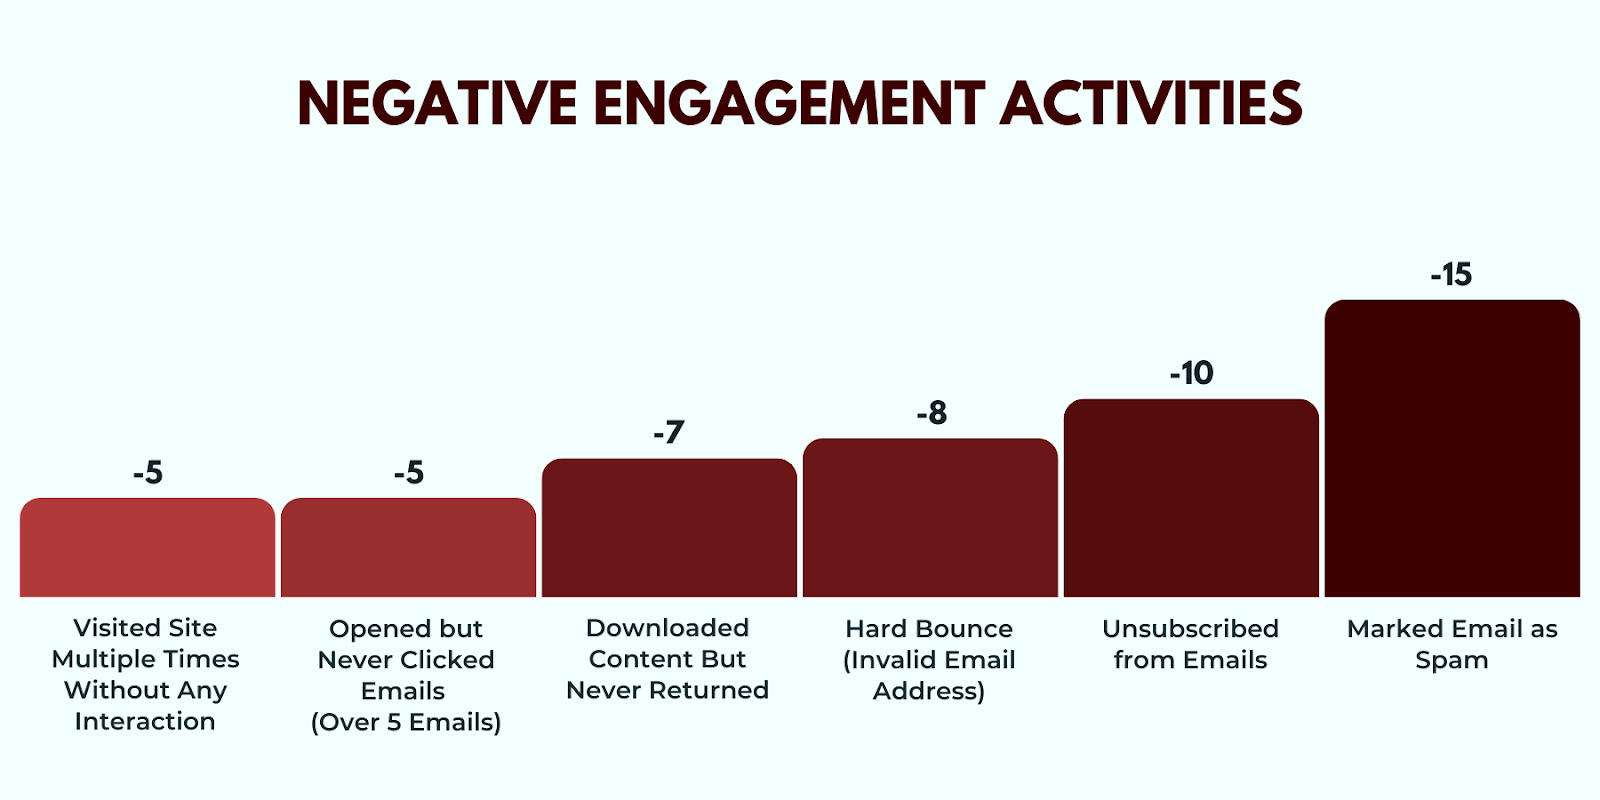
Negative Engagement Activities:
- Unsubscribed from Emails (-10 points): No longer wants communication, low intent.
- Marked Email as Spam (-15 points): Actively avoiding contact, not a lead worth pursuing.
- Hard Bounce (Invalid Email Address) (-8 points): Bad data, should be removed from scoring.
- Visited Site Multiple Times Without Any Interaction (-5 points): Could be a competitor or passive researcher.
- Opened but Never Clicked Emails (Over 5 Emails) (-5 points): Passive engagement, unlikely to convert.
- Downloaded Content But Never Returned (-7 points): Interest fizzled out, likely not a serious buyer.
Why It Matters: Helps assess how leads interact with your marketing content. It provides insight into which leads are worth pursuing and which aren’t.
Pro Tip: Use engagement scoring alongside intent signals to distinguish casual interest from real buying intent. A lead watching multiple product videos and visiting the pricing page is far more valuable than someone who just opens emails.
2. Demographic & Firmographic Lead Scoring
Not all leads are equally valuable to your business. Some have authority and budget, while others have no buying power.
Formula: Assign points based on job title, company size, industry, and location to ensure they fit your ideal customer profile (ICP).
Scoring Breakdown Example:
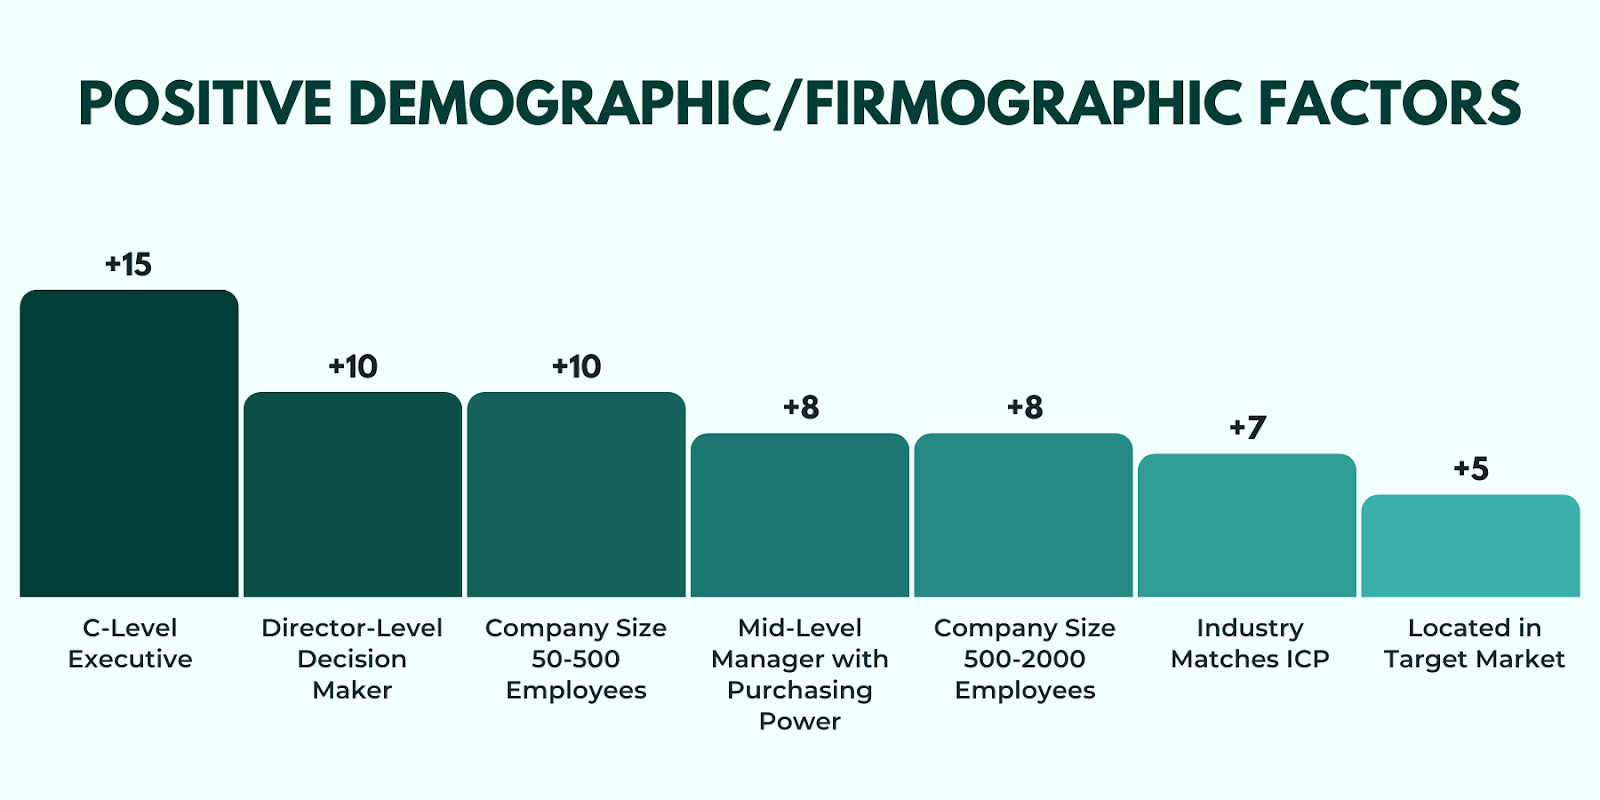
Positive Demographic/Firmographic Factors:
- C-Level Executive (CEO, CMO, VP) (+15 points): These are top decision-makers with the authority to approve purchases.
- Director-Level Decision Maker (+10 points): They influence purchasing but may need approval from leadership.
- Mid-Level Manager with Purchasing Power (+8 points): Often the ones researching solutions and making recommendations.
- Company Size 50-500 Employees (+10 points): Typically have structured budgets and dedicated teams for purchasing.
- Company Size 500-2000 Employees (+8 points): Larger budgets but longer sales cycles, requiring stronger nurturing.
- Industry Matches ICP (e.g., SaaS, Finance, Healthcare) (+7 points): Selling to the right industry improves conversion rates.
- Located in Target Market (e.g., North America, EU) (+5 points): Regions where your product has demand and sales support.
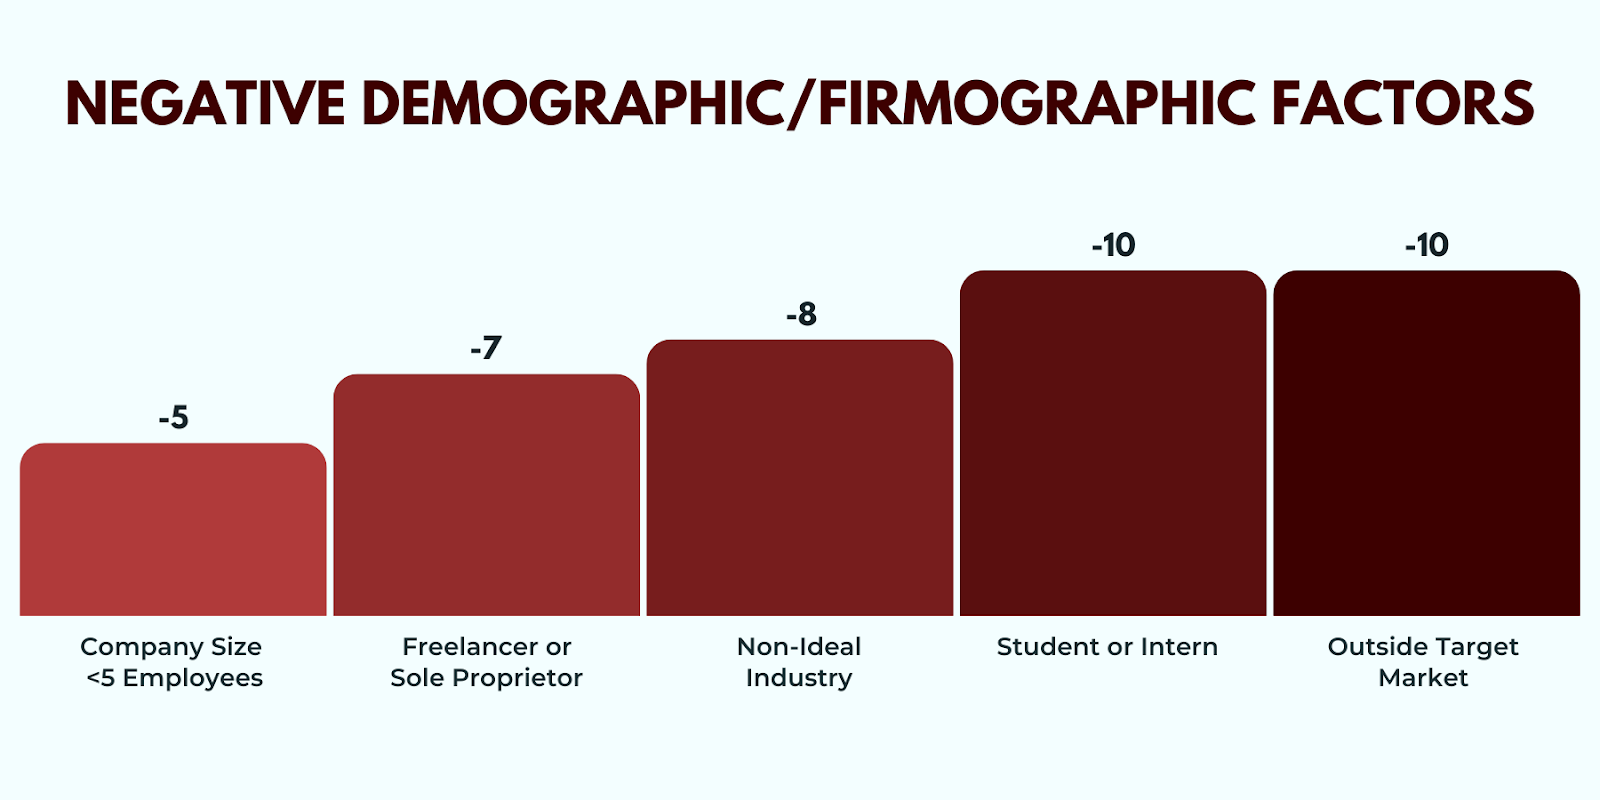
Negative Demographic/Firmographic Factors:
- Student or Intern (-10 points): Not decision-makers and unlikely to make purchases.
- Freelancer or Sole Proprietor (-7 points): May have limited budgets or different business needs.
- Company Size <5 Employees (-5 points): Small businesses often lack the budget or internal resources for enterprise solutions.
- Non-Ideal Industry (e.g., Retail When Targeting B2B SaaS) (-8 points): Mismatch between what you offer and their needs.
- Outside Target Market (e.g., Regions Where You Don’t Sell) (-10 points): Selling in unsupported regions creates friction and low success rates.
Why It Matters: Ensures your leads align with your business’s target market.
Pro Tip: Use historical data to adjust scoring based on your most profitable customer segments. Identify which roles and industries convert the best and adjust weights accordingly.
3. Behavioral Intent-Based Lead Scoring
Engagement alone doesn’t always indicate strong leads. Behavioral intent scoring focuses on actions that show clear purchase intent, like checking pricing or starting a free trial.
Formula: Score leads based on high-intent actions like requesting a demo, downloading a pricing guide, or adding a product to the cart.
Scoring Breakdown:
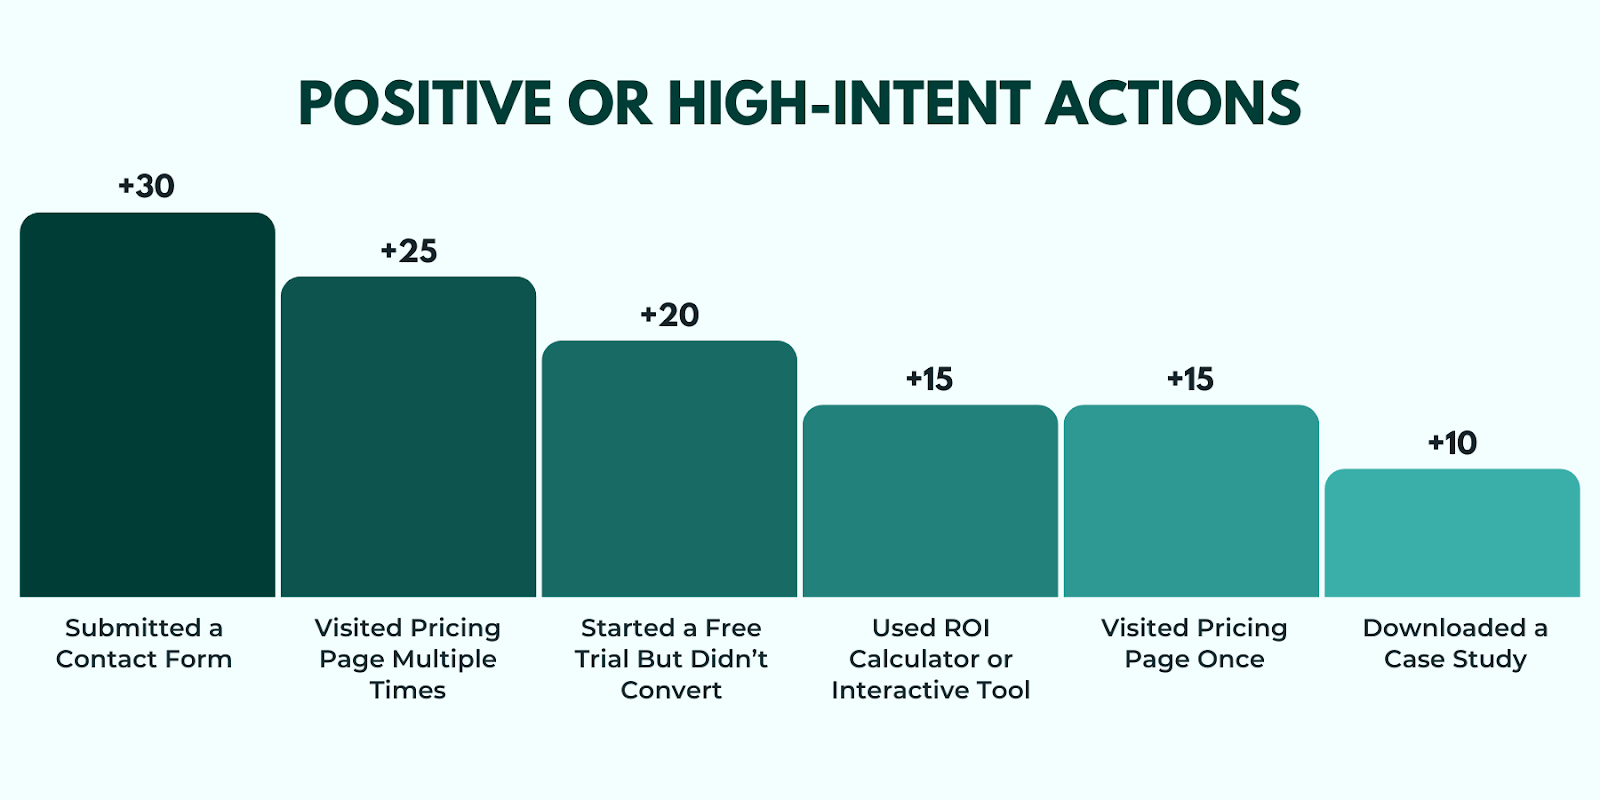
High-Intent Actions:
- Visited Pricing Page Once (+15 points): Leads who check pricing often have an interest in moving forward.
- Visited Pricing Page Multiple Times (+25 points): Revisiting the pricing page suggests deeper consideration and readiness to act.
- Downloaded a Case Study (+10 points): Case studies are proof of value, so downloading one shows genuine interest.
- Used ROI Calculator or Interactive Tool (+15 points): Leads using tools to calculate return on investment are seriously considering a purchase.
- Started a Free Trial But Didn’t Convert (+20 points): They’ve taken a step toward the product, but further nurturing is needed to close the deal.
- Submitted a Contact Form (+30 points): Filling out a form shows strong intent, signaling they’re ready to engage with a sales rep.
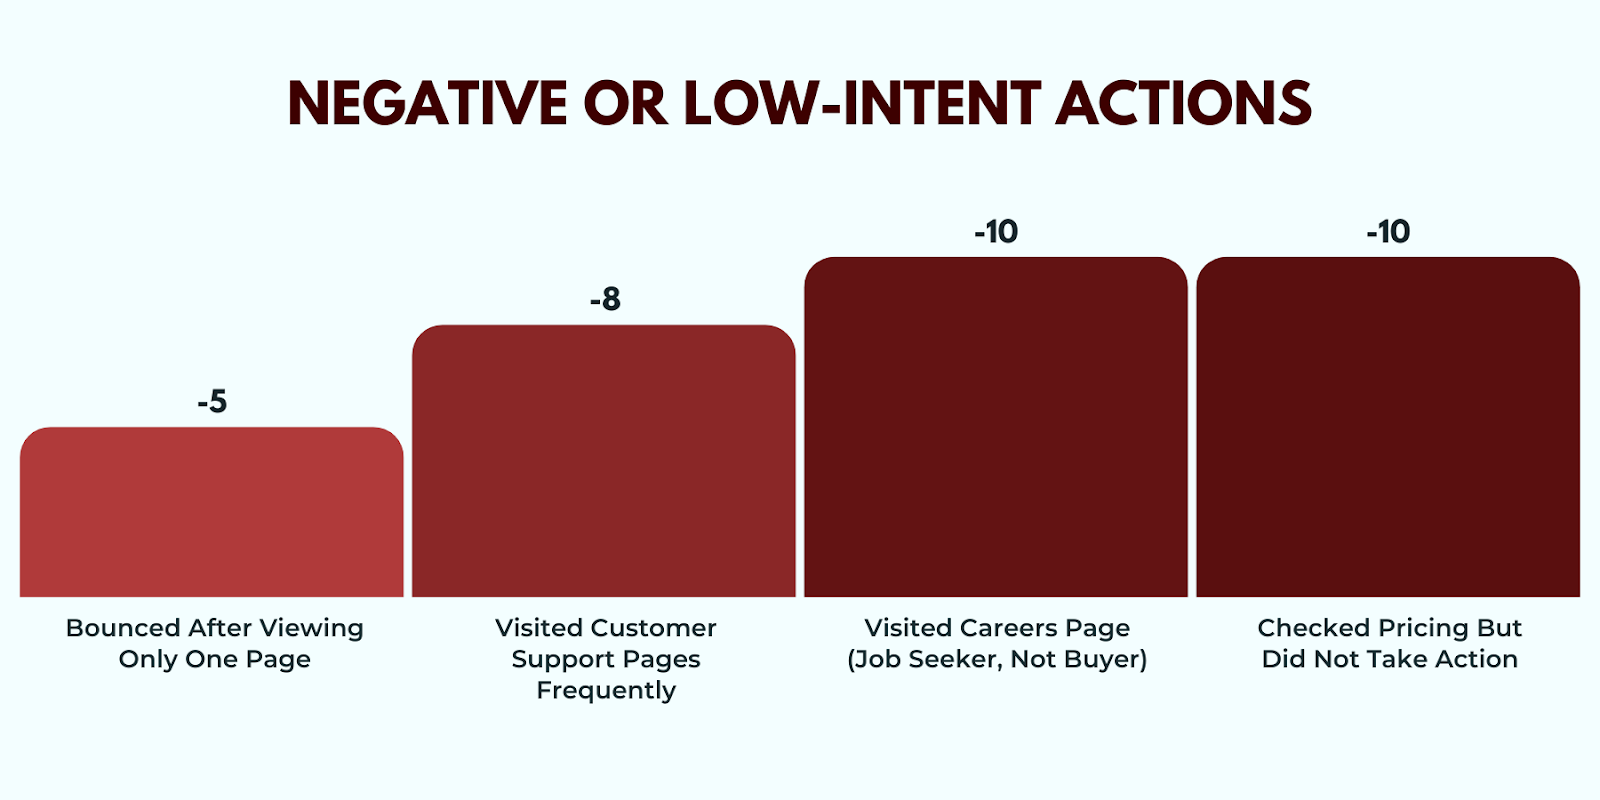
Low-Intent or Negative Actions:
- Visited Careers Page (Job Seeker, Not Buyer) (-10 points): They’re likely interested in job opportunities, not your product.
- Visited Customer Support Pages Frequently (-8 points): Frequent visits to support pages could signal dissatisfaction, but not a buying intent.
- Checked Pricing But Did Not Take Action (-10 points): Browsing pricing without further engagement often shows a lack of real interest.
- Bounced After Viewing Only One Page (-5 points): They may not be ready to engage if they don’t stay long enough to explore more of your site.
Why It Matters: Helps identify leads with strong purchase intent and signals the need for immediate follow-up.
Pro Tip: Combine behavioral intent scoring with lead nurturing. Even leads that show strong intent but don’t convert right away can be re-engaged with follow-ups, personalized offers, or reminders.
4. Lead Source & Channel-Based Lead Scoring
The source of a lead often indicates its quality. Some channels, like organic search or referrals, tend to generate more qualified leads, while others might bring in irrelevant or low-intent leads.
Formula: Assign points based on the lead source: organic, paid, social media, referral, etc.
Scoring Breakdown:
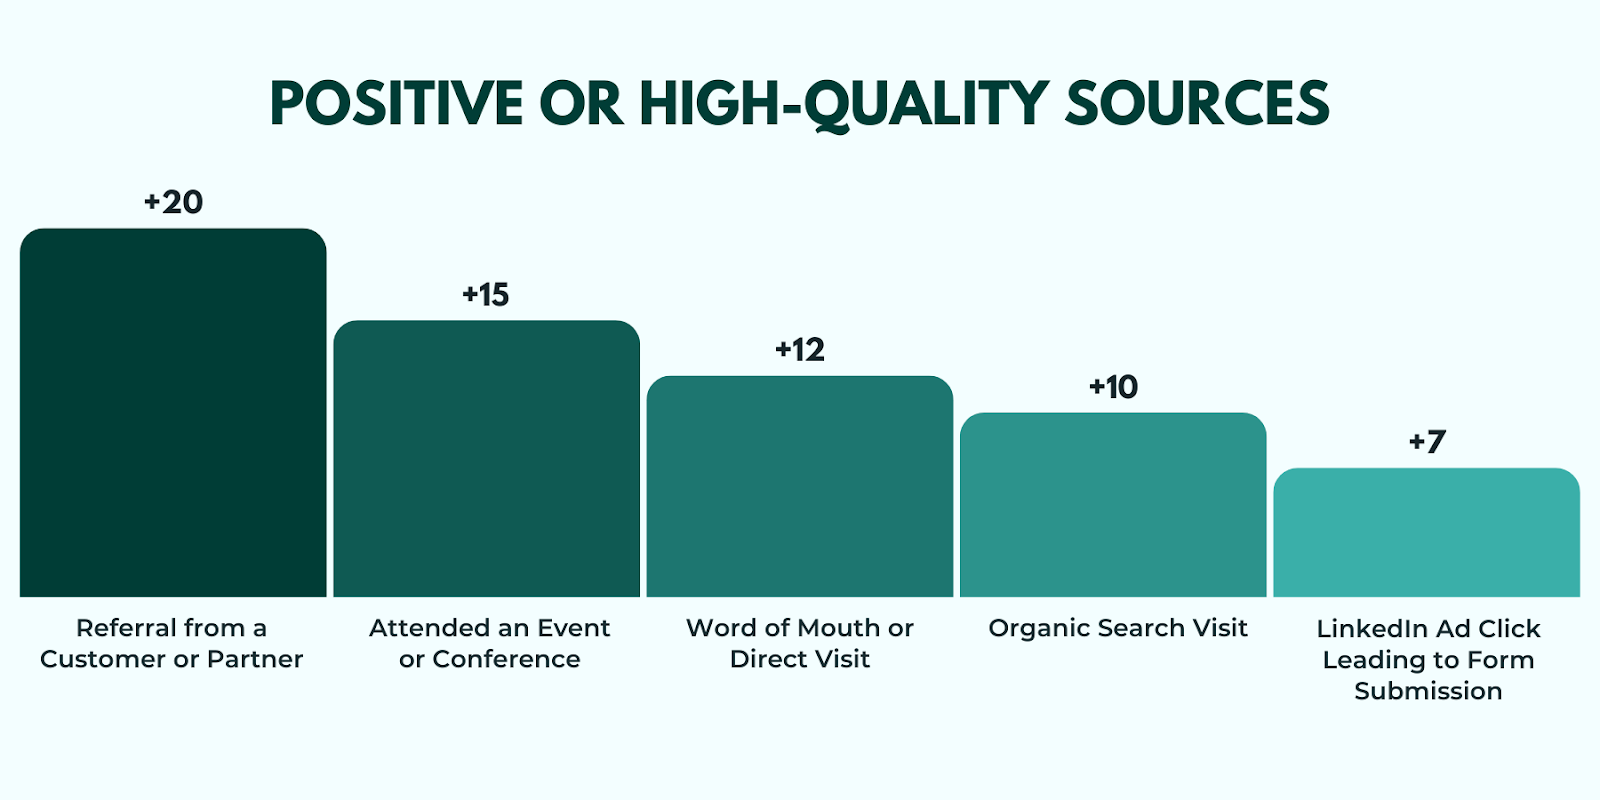
High-Quality Sources:
- Referral from a Customer or Partner (+20 points): Leads coming through trusted referrals are more likely to convert because they come with built-in trust.
- Organic Search Visit (Google, Bing, etc.) (+10 points): Organic traffic is driven by people actively searching for your products, signaling interest and intent.
- LinkedIn Ad Click Leading to Form Submission (+7 points): Leads clicking on LinkedIn ads and submitting forms are likely engaged with your offering.
- Attended an Event or Conference (+15 points): Attendees who interact with your brand in person are often more engaged and interested in learning more.
- Word of Mouth or Direct Visit (+12 points): Direct visits or word-of-mouth referrals show that people are actively seeking your brand, often a strong signal of interest.
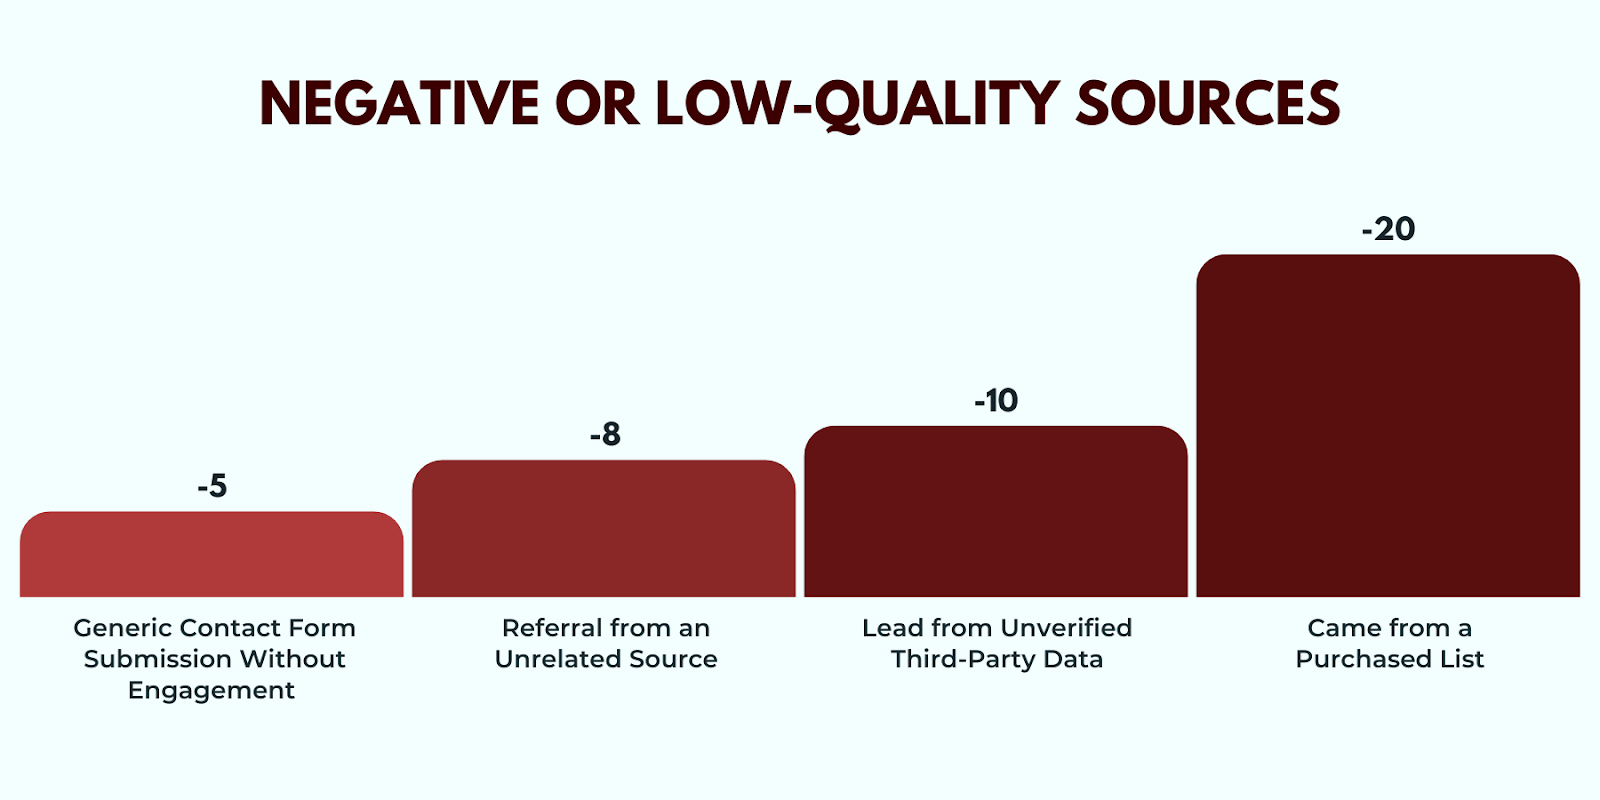
Low-Quality or Spammy Sources:
- Came from a Purchased List (-20 points): Purchased lists often consist of unqualified leads who aren’t actively interested in your product or service.
- Generic Contact Form Submission Without Engagement (-5 points): Submitting a form without any follow-up or engagement signals a lack of genuine interest.
- Lead from Unverified Third-Party Data (-10 points): Unverified data sources may introduce inaccurate or irrelevant leads, wasting your time and resources.
- Referral from an Unrelated Source (e.g., Job Boards) (-8 points): Leads referred from sources that don’t match your target market, like job boards, aren’t likely to be interested in buying.
Why It Matters: Prioritizes leads from high-converting sources over lower-quality ones.
Pro Tip: Regularly assess the performance of your lead sources. By tracking how different channels perform in terms of conversions, you can fine-tune your marketing spend and ensure it’s working for you.
5. Sales Interaction & Lifecycle Lead Scoring
As leads engage with sales, their readiness to buy evolves. Lead scoring should reflect these changes in real-time.
Formula: Adjust lead scores based on sales interactions and progression through the sales funnel.
Scoring Breakdown:
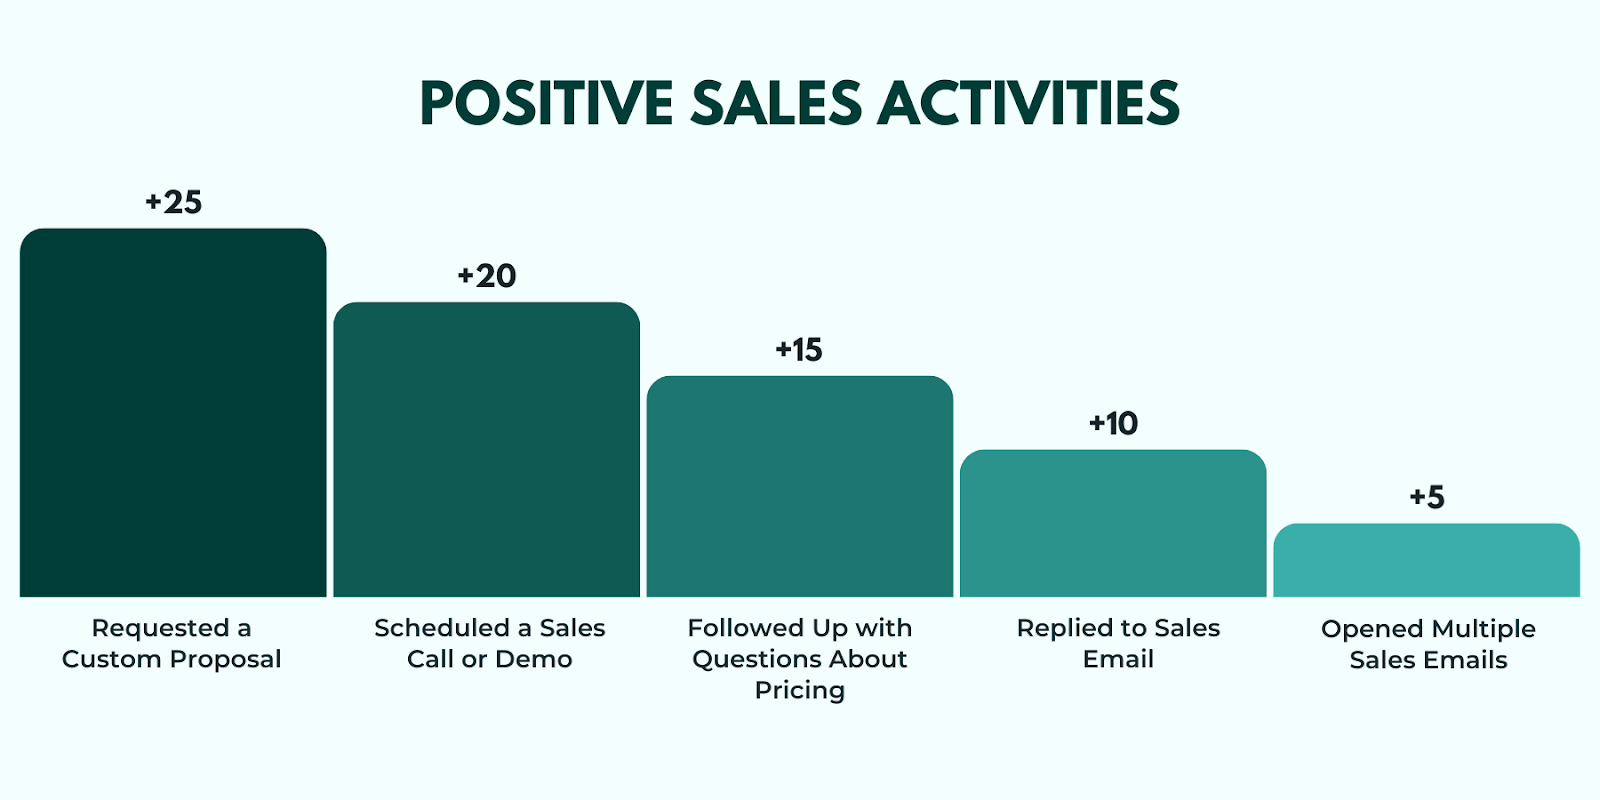
Positive Sales Interactions:
- Replied to Sales Email (+10 points): A response indicates interest and willingness to engage further with your team.
- Scheduled a Sales Call or Demo (+20 points): Leads that schedule calls or demos are typically very engaged and are moving closer to making a decision.
- Opened Multiple Sales Emails (+5 points): Repeated email opens indicate a lead is still considering your offering and has an ongoing interest.
- Requested a Custom Proposal (+25 points): Requesting a proposal shows serious intent to purchase and indicates they’re evaluating your solution more closely.
- Followed Up with Questions About Pricing (+15 points): Inquiries about pricing suggest the lead is near the decision stage and actively comparing options.
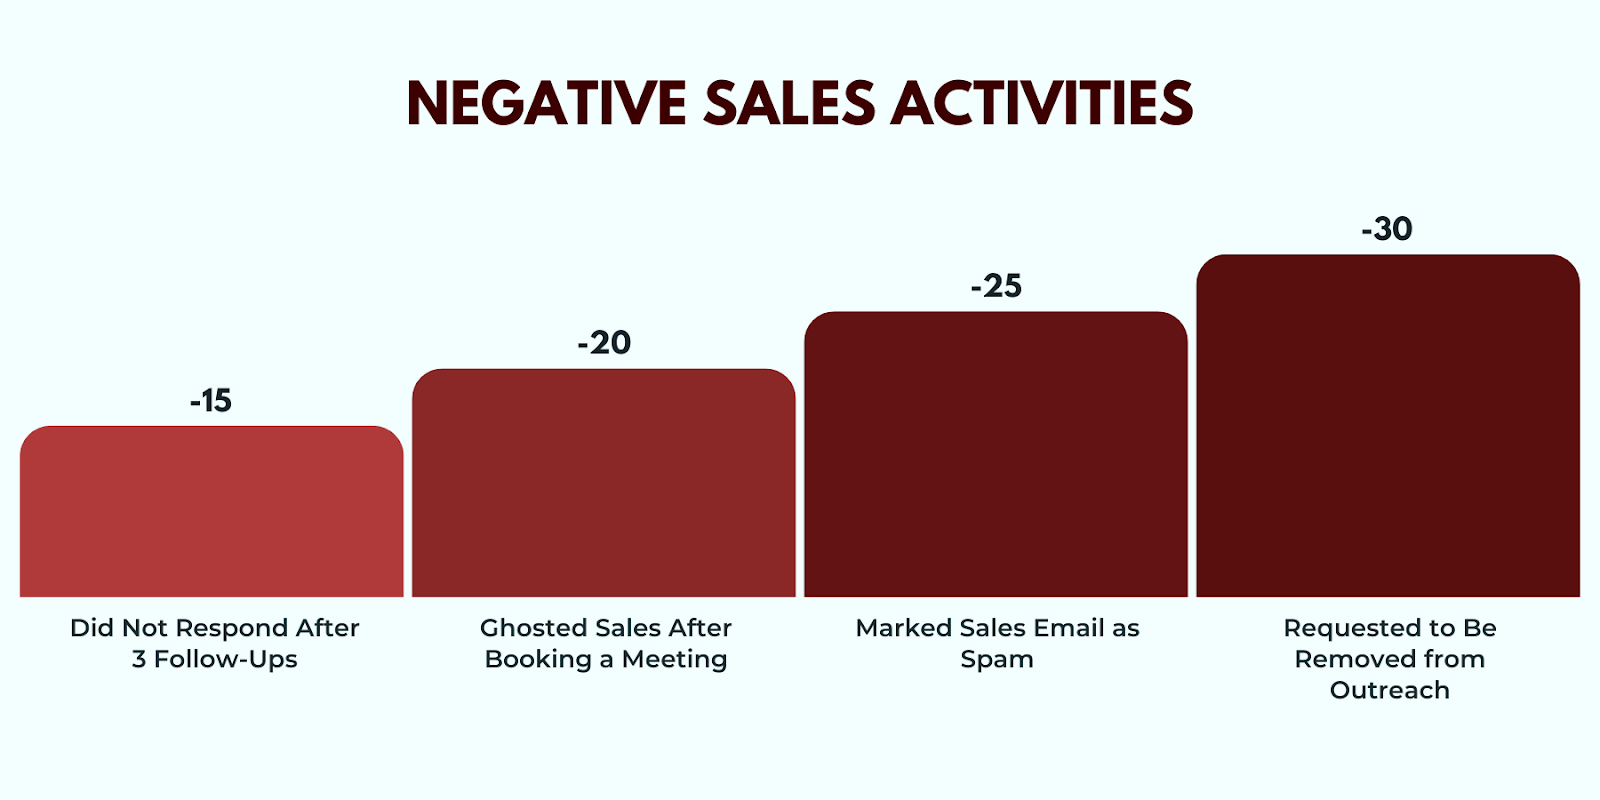
Negative Sales Interactions:
- Did Not Respond After 3 Follow-Ups (-15 points): If a lead stops responding after multiple attempts, they may not be as interested anymore.
- Ghosted Sales After Booking a Meeting (-20 points): A no-show or lack of follow-up after booking a meeting signals the lead may no longer be committed.
- Marked Sales Email as Spam (-25 points): This action shows the lead has lost interest and no longer wants to receive outreach.
- Requested to Be Removed from Outreach (-30 points): A request to be removed is a clear indication that the lead is not interested and may never convert.
Why It Matters: Keeps lead scores updated based on sales interactions, helping prioritize leads and ensuring timely follow-ups.
Pro Tip: Use HubSpot workflows to automatically adjust lead scores based on sales activities. This ensures scores stay accurate, saving time and focusing sales efforts on leads most likely to convert.
Sample Lead Scoring Templates for Different Business Models
Lead scoring varies depending on the nature of the business. Understanding which behaviors and actions matter most for your specific business model will help you build an effective scoring system.
SaaS Example
High weight:
- Product demo requests
- Free trial sign-ups
- Interactions with pricing pages
Low weight:
- Blog engagement (unless deeper product engagement is shown)
B2B Services Example
High weight:
- Decision-maker job titles
- Company size
- Industry-specific firmographics
- Meeting requests
Low weight:
- General website engagement (e.g., clicks, basic inquiries)
E-commerce Example
High weight:
- Adding items to the cart
- Repeat site visits
- Purchase history
Low weight:
- Single-visit users without checkout activity
Consulting Example
High weight:
- Requesting consultations
- Downloading white papers
- Attending webinars
- Industry and company size firmographics
Low weight:
- Basic content engagement without further intent to seek professional advice
Nonprofit Example
High weight:
- Event sign-ups
- Donation forms completed
- Volunteer applications
- Donor history and engagement with campaigns
Low weight:
- Educational content engagement (e.g., blog posts) without actionable intent
Why Lead Scoring Fails
Lead scoring is a powerful tool, but it can fall short if not executed correctly.

Over-Reliance on Engagement Metrics
High engagement, like email opens or clicks, doesn’t always mean a lead is ready to buy. Some leads may just be gathering information. Overvaluing these actions can distort lead prioritization.
Ignoring Negative Signals
Ignoring signs like unsubscribes or disengagement can waste time. Leads who repeatedly show low interest should have their scores lowered. Not factoring this in can hurt team productivity.
Not Aligning with Sales Teams
If sales teams don’t trust the lead scoring system, it won’t be effective. Sales should be involved in the scoring process to ensure it aligns with their lead evaluation.
Failing to Update the Model
Lead scoring needs to evolve. What worked six months ago may not apply today. Regular updates help keep your scoring relevant and aligned with business goals.
How to Validate and Test Your Lead Scoring Model
Once you’ve set up your lead scoring system, testing and validation are crucial to ensure it’s effective. A good model should accurately predict the likelihood of a lead converting into a customer. These steps will help you assess if your lead scoring formula is working.
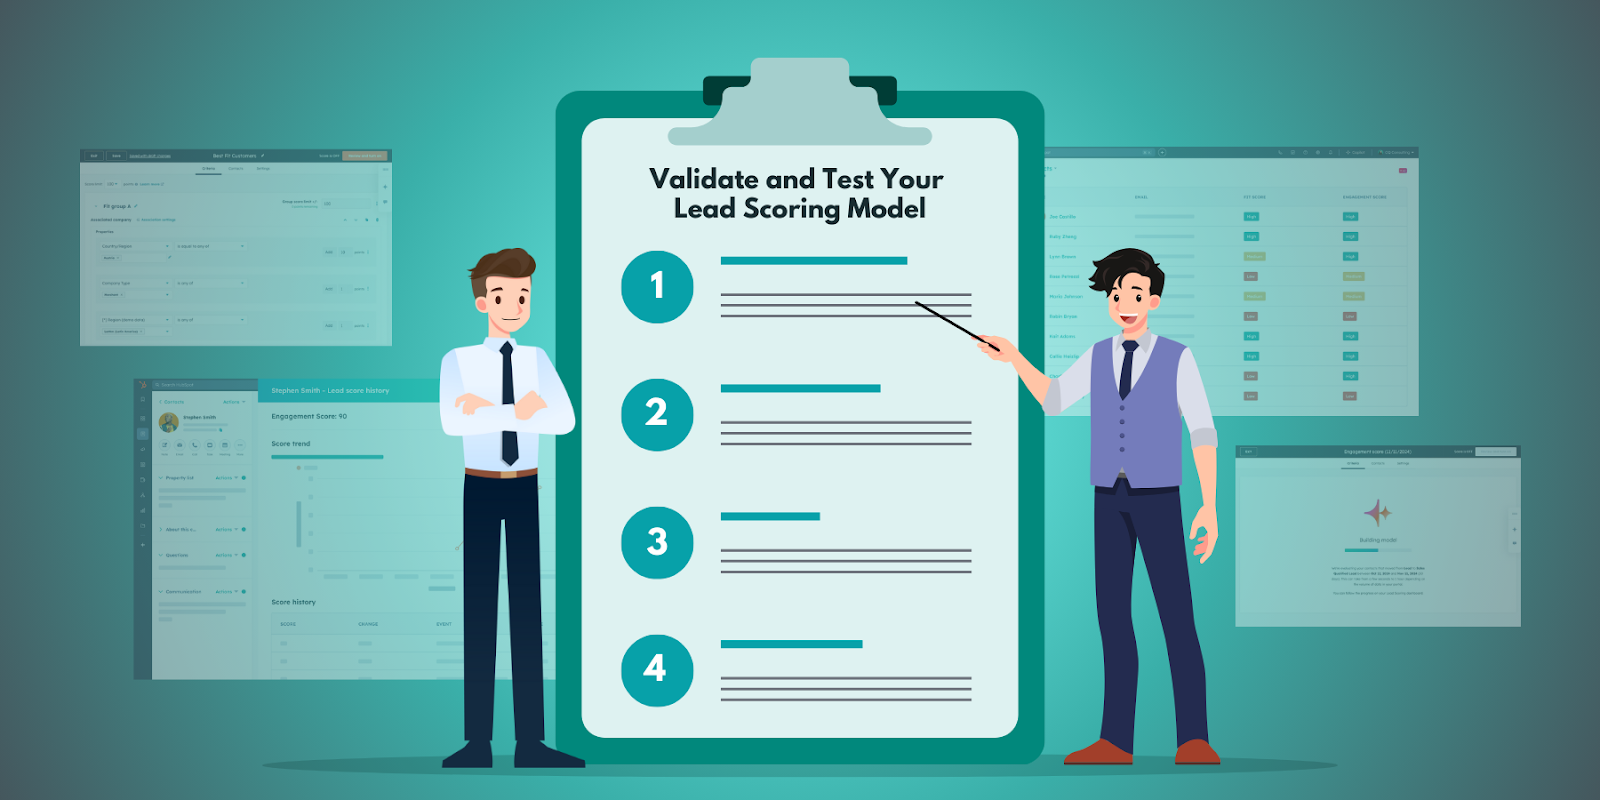
1. Compare Scores to Actual Conversions
Check if the leads with the highest scores are actually converting at a higher rate. If your scoring system is working well, the leads with higher scores should show more interest in your products or services. If not, it could indicate that your scoring criteria are misaligned with what drives conversions.
2. Get Feedback from Sales Teams
Sales teams are on the front lines, so their input is invaluable. Are they finding that the high-scoring leads are the ones they should focus on? If sales reps aren’t seeing value in the scoring model, it might need to be adjusted to align more with how they evaluate leads.
3. Run A/B Tests
Test different lead scoring models to see which one predicts conversion rates more accurately. By creating variations of your scoring system, you can experiment with different point values and criteria, helping you pinpoint what truly matters when identifying leads ready to buy.
4. Use HubSpot Reporting
Use HubSpot’s reporting tools to track how lead scores correlate with actual closed deals. You can easily analyze the data to determine if the leads with the highest scores are leading to successful sales. This will provide you with hard data to assess the effectiveness of your lead scoring system.
Fine-Tune Your Lead Scoring for Maximum Impact
Setting up a lead scoring system in HubSpot helps prioritize the leads most likely to convert, allowing your team to focus on high-value prospects. To get the most out of your lead scoring, customize it to match your business goals and customer behavior.
Keep in mind that each business is unique, so don’t rely on one-size-fits-all models. Instead, take the time to customize your scoring criteria based on your target audience and sales process. Lead scoring isn’t set-and-forget. As your business evolves and new data comes in, you’ll want to revisit and tweak your scoring model. A system that works today might not be as effective in six months, so make sure to keep an eye on the performance.
If you’re ready to make lead scoring work for your business or need help customizing your system, LZC Marketing can guide you through the process. Consulting with a HubSpot expert can save you time and ensure that your lead scoring model is driving accurate results.
Want to learn more about how HubSpot can drive growth for your business?
Connect with us and discover how HubSpot can support your success.
Schedule a Consultation
Frequently Asked Questions (FAQs)
How does HubSpot handle lead scoring?
HubSpot allows users to create both manual (rule-based) and predictive (AI-powered) lead scoring. Manual scoring assigns points based on defined criteria, while predictive scoring uses HubSpot’s AI to analyze past data and suggest high-converting leads.
How do I decide the weight of lead scoring points?
Start by analyzing historical data, look at leads that converted into customers and identify common behaviors. Assign higher scores to strong buying signals (e.g., demo requests) and lower scores to soft signals (e.g., blog visits). Regularly adjust weights based on conversion trends.
What is the difference between engagement-based and intent-based lead scoring?
Engagement-based scoring tracks general interactions like email opens and blog visits. Intent-based scoring focuses on high-intent actions such as viewing the pricing page, requesting a proposal, or booking a demo. Intent-based scoring should carry more weight.
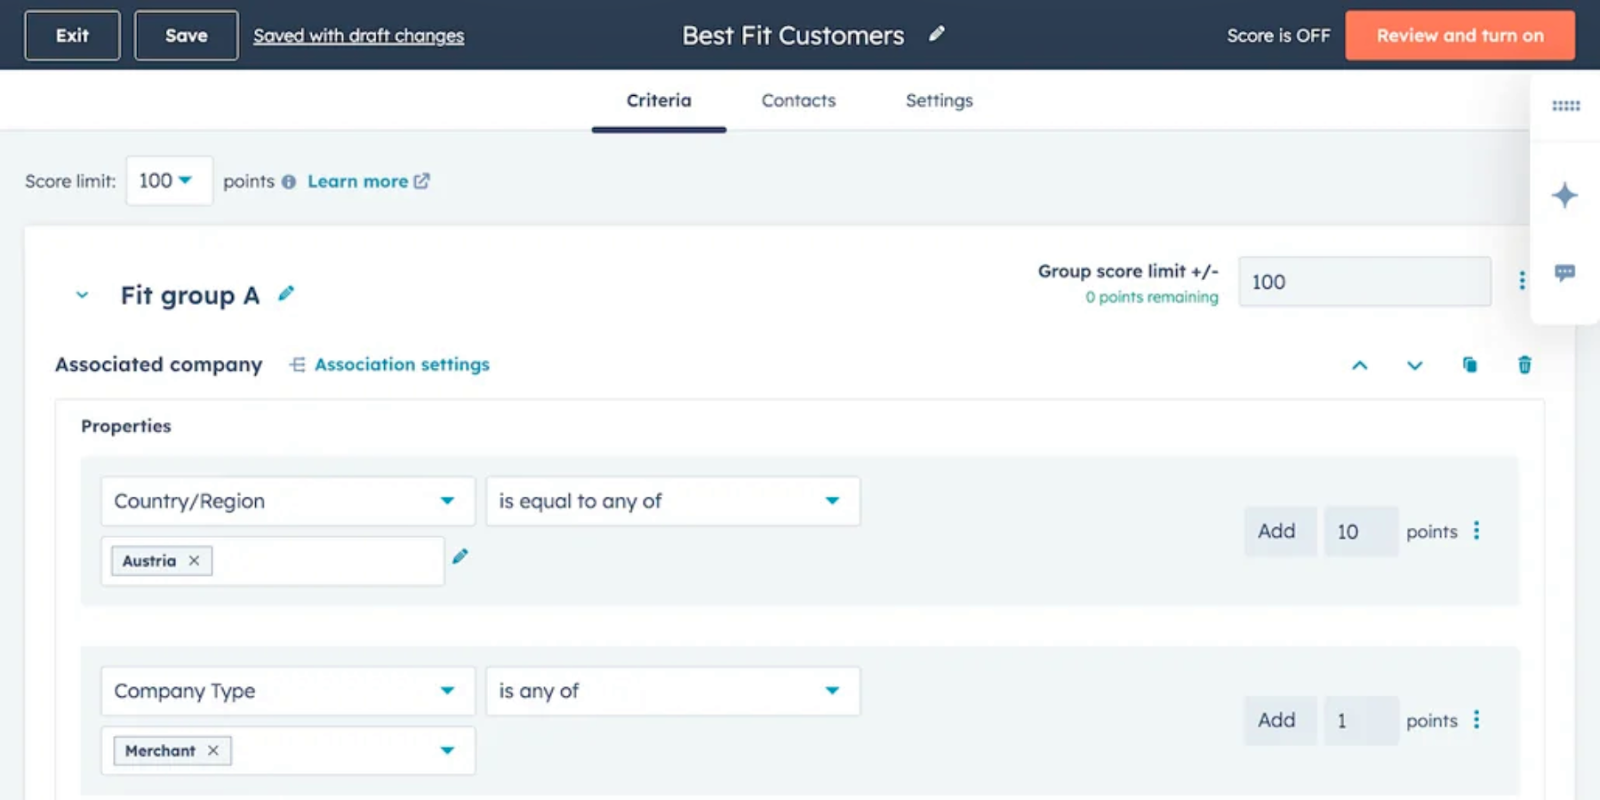
How do I set up lead scoring in HubSpot?
To set up lead scoring in HubSpot: Navigate to Settings > Properties. Search for the HubSpot Score property. Add positive and negative criteria to define how points are assigned. Save and test your scoring model. However, you may also need to configure predictive lead scoring if it’s available in your plan
Can I automate lead scoring in HubSpot?
Yes, HubSpot allows automated lead scoring using workflows. You can trigger notifications when a lead reaches a specific score, move leads between lifecycle stages automatically, and assign sales reps based on lead scores.


